We all know, SQL Server R Services is one of the new feature introduced in the recent release of SQL Server.
Below are the benefits of integrating the R language within SQL Server:
i) keep analytics close to the data
ii) eliminate the costs and security risks associated with data movement.
So it means, we can use the rich and powerful R language within SQL Server management studio (SSMS) to create models and generate predictions using your SQL Server data.
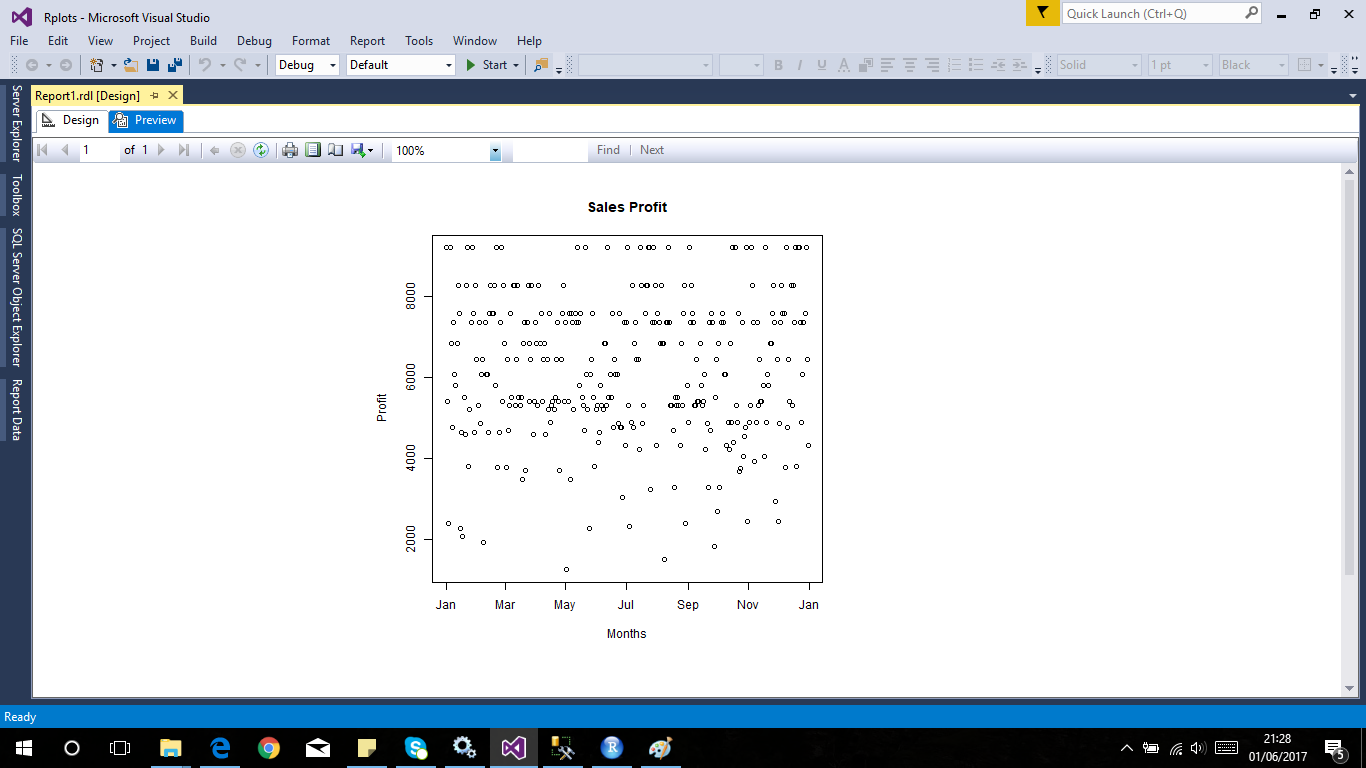
In this post, let us see how the visualizations created using R can be presented on SSRS.
Below are the steps to be followed:
I) Create sample database with filestream enabled and then create file table
II) Create R script -> input data for R script is data from mssql sample database (WorldwideImportersDW)
III) Create SSRS report with Image report item, input for this report is from filetable


Below are the benefits of integrating the R language within SQL Server:
i) keep analytics close to the data
ii) eliminate the costs and security risks associated with data movement.
So it means, we can use the rich and powerful R language within SQL Server management studio (SSMS) to create models and generate predictions using your SQL Server data.
In this post, let us see how the visualizations created using R can be presented on SSRS.
Below are the steps to be followed:
I) Create sample database with filestream enabled and then create file table
II) Create R script -> input data for R script is data from mssql sample database (WorldwideImportersDW)
III) Create SSRS report with Image report item, input for this report is from filetable
Step 1: Enable Filestream and then create file table

CREATE DATABASE RptR
WITH FILESTREAM
(
NON_TRANSACTED_ACCESS = FULL,
DIRECTORY_NAME = N'ReportDetail_FileTable'
);
GO

ALTER DATABASE RptR
ADD FILEGROUP RptR_FG
CONTAINS FILESTREAM;
GO


ALTER DATABASE RptR
  ADD FILE ( NAME = N'MSSQLFT',
             FILENAME = N'C:\MSSQLFT' )
     TO FILEGROUP [RptR_FG]
GO

USE RptR
GO

CREATE TABLE ReportDetail_FileTable AS FILETABLE
ON [PRIMARY] FILESTREAM_ON [RptR_FG]
WITH
(
FILETABLE_DIRECTORY = 'ReportDetail_FileTable',
FILETABLE_COLLATE_FILENAME = database_default
);
GO

SELECT * FROM ReportDetail_FileTable
Step 2: Execute R script
--Method 1 : Exporting the chart generated from R into a folder and then using OPENROWSET inserting into Filetable
USE RptR
GO

DECLARE @SQL NVARCHAR(MAX) = N'
SELECT
        [Invoice Date Key] InvoiceDateKey
      ,MAX([Tax Rate]) TaxRate
      ,MAX([Profit]) Profit
  FROM [WideWorldImportersDW].[Fact].[Sale]
  WHERE YEAR([Invoice Date Key]) = 2015
  GROUP BY [Invoice Date Key];'

DECLARE @RScript NVARCHAR(MAX) =N'
    png("H:/Blog/R/ProfitPlotchart.png");
    plot(InputDataSet$InvoiceDateKey,InputDataSet$Profit,main = "Sales Profit",xlab = "Months", ylab = "Profit");
    dev.off(); '
EXEC   sp_execute_external_script
      @language = N'R'
     ,@script = @RScript
 ,@input_data_1 = @SQL


INSERT INTO [dbo].[ReportDetail_FileTable] ([name],[file_stream])
SELECT'ProfitPlotchart.png',*
 FROM OPENROWSET(BULK N'H:/Blog/R/ProfitPlotchart.png', SINGLE_BLOB) AS FileData
GO
--Method 2 : Converting the chart generated from R into binary format & stored inside data frame and then inserted into Filetable
USE RptR
GO

DECLARE @SQL NVARCHAR(MAX) = N'
SELECT
        [Invoice Date Key] InvoiceDateKey
      ,MAX([Tax Rate]) TaxRate
      ,MAX([Profit]) Profit
  FROM [WideWorldImportersDW].[Fact].[Sale]
  WHERE YEAR([Invoice Date Key]) = 2015
  GROUP BY [Invoice Date Key];'

DECLARE @RScript NVARCHAR(MAX) =N'
    image_file = tempfile();
    jpeg(filename = image_file, width=600, height=600);
    plot(InputDataSet$InvoiceDateKey,InputDataSet$Profit,main = "Sales Profit",xlab = "Months", ylab = "Profit");
    dev.off();
    OutputDataSet <- data.frame(data=readBin(file(image_file,"rb"),what=raw(),n=1e6));
    '


DECLARE @Plot VARBINARY(MAX);
DECLARE @Tmp TABLE(Plot VARBINARY(MAX))
INSERT @Tmp
EXEC  sp_execute_external_script
       @language = N'R'
      ,@script = @RScript
   ,@input_data_1 = @SQL
      ,@params = N'@Rplot varbinary(max) OUTPUT'
      ,@Rplot = @Plot OUTPUT;

INSERT INTO [dbo].[ReportDetail_FileTable] ([name],[file_stream])
SELECT 'ProfitPlotchart1.png',(SELECT Plot FROM @Tmp)
Step 3: Create SSRS report with dataset & image properties pointing to file table as shown below


No comments:
Post a Comment